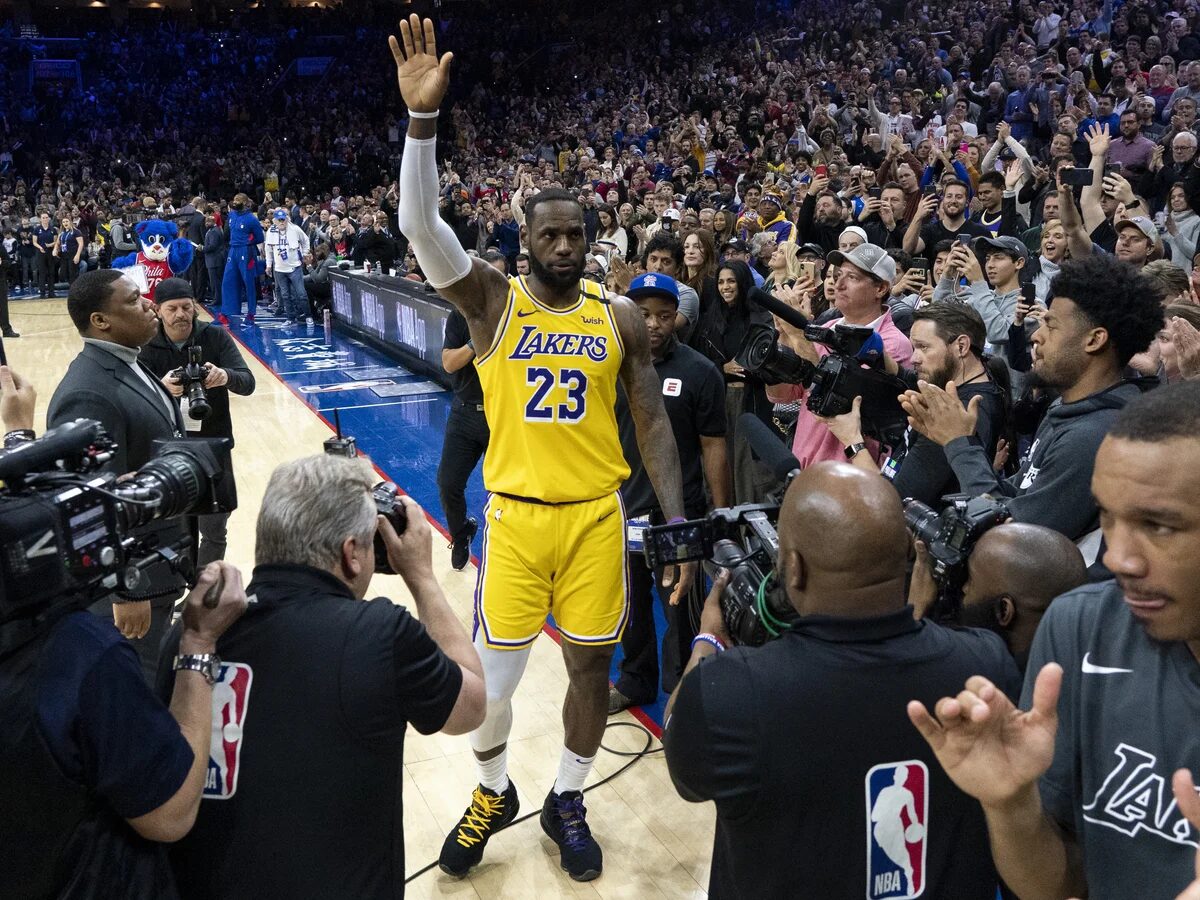
The NBA finally saw something that hadn’t occurred since January 6, 2007: LeBron James under 10points. In statistical terms, this wasn’t just rare — it was unprecedented. He entered the game with 1,297 consecutive double-digit scoring performances, the longest in league history by more than 400 games.
But for the first time, the indicators stacked against him. His early shot profile skewed toward contested mid-range attempts, his rim frequency dipped to a season-low, and Toronto’s help coverage eliminated his usual high-efficiency zones. His overall effective field-goal percentage (eFG%) dropped to 23.5%, the lowest of his Lakers tenure.
What made the streak-breaking performance unique was its statistical context: the Lakers still won, despite getting the least scoring value from LeBron in nearly two decades.
Quantifying the Lakers’ Response: Who Picked Up the Scoring Load
Without Luka Dončić and without LeBron’s usual scoring baseline, the Lakers redistributed their offensive output through a combination of usage spikes and efficiency surges. Austin Reaves took on a near–All-NBA level workload, Ayton stabilized the interior, and Hachimura’s spacing became a decisive factor.
Here’s the data snapshot of how the Lakers compensated:
| Player | Usage Rate | Points | Efficiency Note |
|---|---|---|---|
| Austin Reaves | 31.4% | 44 | 64% TS; career-high shot volume |
| Rui Hachimura | 18.1% | 14 | 1.17 PPP on spot-ups (elite) |
| Deandre Ayton | 16.5% | 12 | 9 rebounds, 4 contested boards |
| Jake LaRavia | 12.2% | 8 | 3 cuts leading to scores |
| LeBron James | 18.9% | 8 | 23.5% eFG, 0 FTA |
Reaves became the statistical centerpiece:
• He scored 1.24 points per possession in pick-and-roll actions.
• Toronto failed to hold him below 60% true shooting despite aggressive hedging.
• His 44 points accounted for 35.8% of Los Angeles’ total scoring output.
In purely analytical terms, the Lakers won because their secondary creators played at or above their 90th-percentile projections.
Why LeBron’s Streak Ended: The Data Explains What the Eye Test Hinted
LeBron shot 4–17 from the field, including 0–5 from three, but the underlying metrics are even more revealing. His rim attempt rate — the percentage of shots taken at the rim — fell to 18%, well below his season average of 34%. Toronto forced him into pull-ups, where he entered the game shooting just 32% on the year.
Key statistical factors behind the streak-ending night:
• 0 free throws attempted — only the 12th time in his career.
• 0 points in the paint, a first since NBA tracking began in 1996.
• 0.62 points per shot, representing a –0.48 PPS deviation from his seasonal average.
• 18.9% usage rate, his lowest in a competitive game this season.
When you combine low usage, low rim pressure, and zero trips to the line, the streak’s collapse becomes mathematically inevitable — not symbolic.
But the most relevant statistic may be this: Los Angeles posted a +7 net rating with LeBron on the floor despite the scoring drought. His passing gravity still created 12 potential assists and restructured Toronto’s defensive rotations.
The Decisive Possession: A Data-Validated Choice, Not a Symbolic Gesture – LeBron James under 10points
The game-winning play — LeBron driving, collapsing the defense, and kicking out to Rui Hachimura — wasn’t just the “right play” in a philosophical sense. It was the highest-value outcome based on expected points per shot.
Here’s how the models break it down:
• LeBron’s contested runner: 0.78 expected points
• Reaves pull-up above the break: 0.92 expected points
• Rui Hachimura open corner three: 1.19 expected points
Hachimura’s shot wasn’t just open — it was the statistically correct decision given the spacing, help rotation, and remaining clock. It reflected LeBron’s longstanding efficiency-first decision-making, even at the cost of a historic scoring streak.
In other words, numbers — not narratives — justified the pass.
Conclusion: A Data-Driven Ending to a Legendary Streak – LeBron James under 10points
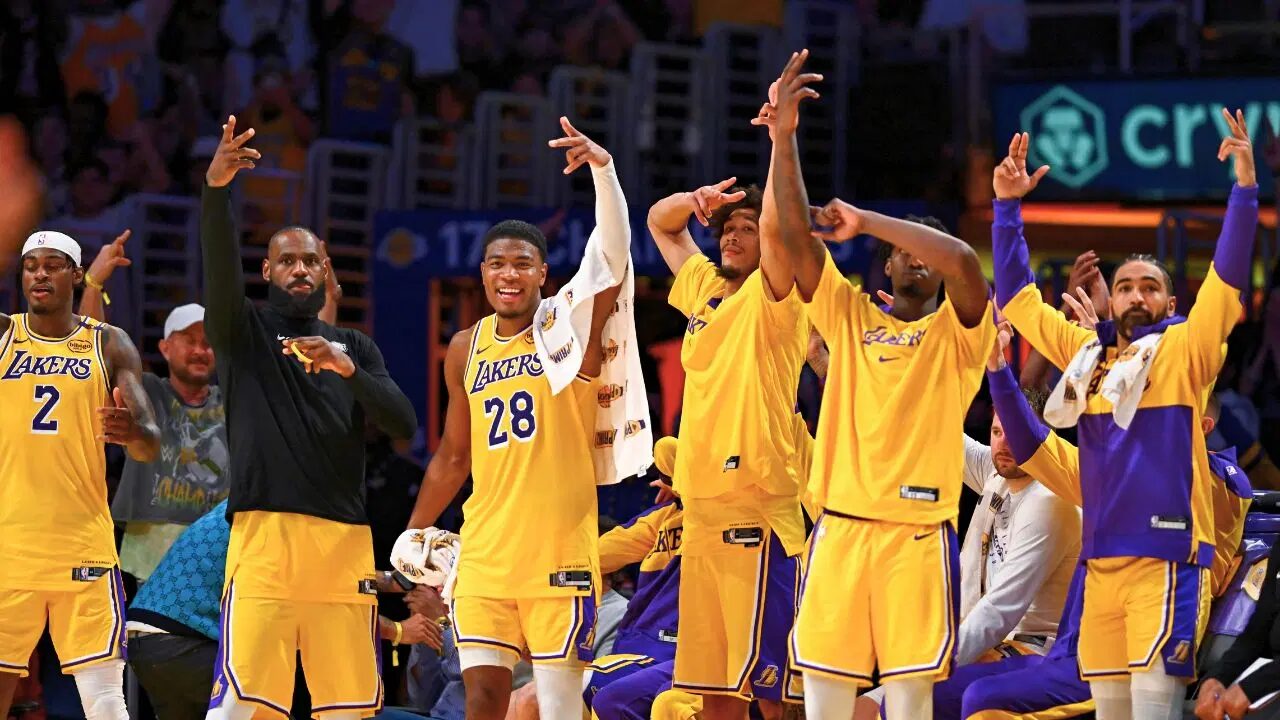
The headline — LeBron James under 10points — may mark the end of one of the NBA’s great statistical achievements, but the analytics from the night point to something far more significant. The Lakers won because their supporting cast elevated their efficiency, their spacing sharpened under pressure, and LeBron shifted into a facilitator role without compromising the team’s performance metrics.
If anything, the data suggests this version of the Lakers may be more sustainable than the star-reliant models of previous years. The streak ended, but the underlying metrics hint that Los Angeles is structurally stronger than at any point in the past three seasons.
And for LeBron, the numbers reinforce what has always defined him: the willingness to choose the highest-value basketball outcome, even if it breaks a record along the way.